What a kilowatt-hour costs around the world, and what it does to the same rig
Household power ranges from about five cents a kWh to over forty, so the same card is profitable in one country and a heater in another. Where the bands sit, why your bill is not one number, and how to find the price that actually applies to your rig.
The spread is the whole story
Two people can buy the same graphics card, run it on the same coin at the same difficulty, and one of them earns money while the other loses it every single day. Nothing about the hardware differs. The bill does.
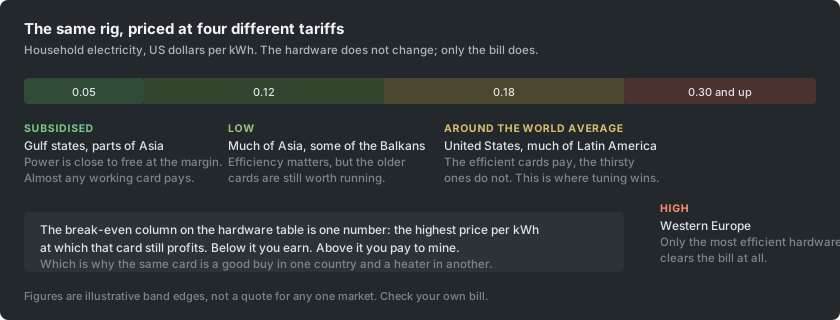
Household electricity worldwide averages somewhere close to eighteen US cents per kWh, but the average is the least useful number in the whole subject. Subsidised markets sell power at around five cents. Several Western European markets sit above thirty. That is a factor of six or more on the one cost that never stops.
Some anchors, with their dates
These are reference points rather than a quote for your address, and every one of them moves. Take the shape from them, then get your own number from your own bill.
- The United States residential average is roughly eighteen cents per kWh in 2026, and the spread inside the country is nearly four to one, from around eleven cents in North Dakota and Utah to around forty in Hawaii.
- The European Union household average was 28.96 euro cents per kWh in the second half of 2025, with Ireland highest at 40.42 and Hungary lowest at 10.82. Belgium, Germany and Denmark all sat above thirty.
- Asia as a region averages far lower, in the region of nine or ten cents, and Gulf states with subsidised tariffs are lower again.
- Movement inside a single year can be violent. In the year to the second half of 2025 Romania rose by more than half, while Cyprus, France and Denmark all fell by more than a tenth.
The last point is the one to take seriously. A rig that was comfortably profitable when you bought it can stop being profitable because of a tariff change you had no part in, and that has happened to whole countries of miners at once.
Your bill is not one number
Typing the figure from the bottom of your bill into a calculator is the usual mistake, because that figure is an average of things that are charged differently. What a mining rig costs you is the marginal price: what the next kilowatt-hour costs, not what the last thousand averaged.
- Block or tiered tariffs. Many countries charge a low rate for the first slice of monthly consumption and a much higher rate after it. A rig running full time pushes you permanently into the top block, so the rig is charged at the top rate even though your average looks moderate.
- Time of use. Where day and night rates differ, a rig that runs twenty four hours pays the blended rate, not the cheap night rate people quote.
- Standing charges. A fixed monthly fee is not affected by the rig at all, so including it in your per kWh figure overstates what mining costs you.
- Taxes and levies. In several markets these are a large part of the price and are what separates otherwise similar countries.
- Demand or capacity charges. Mostly a commercial concern, but some residential tariffs also price your peak draw, and a rig raises your baseline permanently.
Getting your own number
The reliable method takes one bill and a subtraction. Take the total charged for energy, remove the fixed standing charges, and divide by the units consumed. That gives your real average. Then check whether you are in a tiered scheme, and if you are, use the rate of the highest block you land in rather than the average, because that is the rate the rig is charged at.
If the rigs have their own meter, this is much easier and it has a second benefit at tax time: an electricity cost you want to set against mining income is far easier to defend when it was measured rather than estimated.
Then enter that figure in the electricity box above the hardware table. It defaults to a United States style figure because a default has to be something, and it is the single input that changes the ranking most.
Reading the break-even column
The hardware table carries a break-even figure per card, and it is the direct answer to this whole article: the highest electricity price at which that card still earns more than it costs to run. Below that price you profit, above it you pay to mine.
Sorting by it tells you something the profit column does not. Profit answers what a card earns at your price today. Break-even answers how much room the card has before a tariff rise or a difficulty rise takes it under, and on hardware you expect to own for years, that headroom is worth more than a few cents a day.
What to do with an expensive tariff
The honest first answer is that no amount of tuning turns a bad tariff into a good one. What tuning does is move the line, and near the line that is enough to matter.
Undervolting is the strongest lever most people have, because it cuts the power draw more than it cuts the hashrate. On an expensive tariff, the efficient setting is not merely better, it is often the difference between earning and not. The undervolting article covers how to find that setting without guessing.
The other levers are the ones people underrate: heat that you would otherwise pay to produce is not waste in a cold month, and a rig in a room you are heating anyway has a genuinely different economics from the same rig in a room you are cooling.